Value at Risk (VaR): Formula, Calculation & Real-World Examples
Learn what Value at Risk (VaR) is, how it works, its formula, calculation methods, real examples, and how traders use VaR to manage market risk.
Table of Contents
Market volatility can cost the banks, hedge funds and institutional investors millions in just one day of trading and that is where Value at Risk ( VaR ) comes in to play. The VaR model is one of the most popular risk management models in finance, and it can be used to estimate a portfolio’s maximum loss over a specified time horizon with a given confidence level.
If the one day 95% VaR is $100,000, then there is only a 5% chance that the portfolio will suffer a loss of more than $100,000 in a day. In today’s world, VaR is applied in forex, stocks, crypto and portfolio management and can be used to evaluate risk in the market.
In this guide, we are going to explain what Value at Risk is, what it means, how it is calculated, provide examples, and how it is applied in real-life scenarios by professional traders in the realm of risk management.
What Is Value at Risk (VaR)?
Value at Risk ( VaR) is a measurement of risk management which is used to determine the maximum loss that a portfolio of assets may experience in a given period of time with a probability of 95% or 99%.
One important question that VaR addresses simply is:
“What is the worst that can happen if the market goes against me?”
For instance, a portfolio with a 1-day 95% VaR of $50,000 indicates that there is a 5% risk that the portfolio will suffer a loss greater than $50,000 on any one day.
Today, the following organizations use Value at Risk:
- banks
- hedge funds
- forex traders
- portfolio managers
- crypto investors
To quantify exposure and manage trading risk in a market.
VaR is not a simple risk tool, but rather applies historical data, volatility, and probability models to determine “how much” can be lost prior to the traders committing capital. This is the reason why it is still one of the most critical risk measurement systems in the world of finance.
How Value at Risk Works
The Value at Risk is calculated by taking into consideration three important elements:
- potential loss amount
- time period
- confidence level
These factors, when combined, make an estimate of the loss that could be experienced by a portfolio in normal market conditions.
For Example:
If a bank uses 1 day VaR of $100,000, then there will be a 99% chance that the loss will not exceed $100,000 in a single trading day.
Typical VaR calculations are typically based on:
- historical market data
- portfolio volatility
- asset correlations
- statistical probability models
The more volatile the market becomes, the greater the VAR, as the likelihood of greater fluctuations in price increases.
Banks, hedge funds and professional traders today use VaR to deal with exposure in the forex markets, stocks, commodities and crypto markets.
Value at Risk Formula
The Value at Risk (VaR) formula helps estimate the maximum expected loss of a portfolio over a specific time period under normal market conditions.
The standard VaR formula is:
VaR=Z×σ×t×VVaR = Z \times \sigma \times \sqrt{t} \times VVaR=Z×σ×t×V
Where:
- Z = confidence level score
- σ (sigma) = portfolio volatility
- t = time period
- V = portfolio value
Here’s a simple example:
- Portfolio value = $1,000,000
- Daily volatility = 2%
- Confidence level = 95%
Using the formula, traders can estimate the maximum likely loss for a single trading day.
This method is commonly known as Normal VaR or Parametric VaR because it assumes market returns follow a normal distribution. Many banks and financial institutions use this approach because it is fast, standardised, and easy to apply across large portfolios.
Methods of Value at Risk Calculation
Value at Risk ( VaR ) has three major approaches to calculating it. These approaches have varying forms of risk measures depending on the type of portfolio, market conditions, and desired level of accuracy.
1. Historical Simulation
This approach is based on past market losses and uses them to forecast future losses. It compares a portfolio’s performance for the previous period of market volatility to the current portfolio positions.
Best for:
- real market behavior
- simple portfolio analysis
Limitation:
depends heavily on historical data
2. Parametric VaR
It is also referred to as the Variance-Covariance method and is based on the premise that markets are normally distributed and that volatility and standard deviation are used to measure risk.
Best for:
- stable markets
- large institutional portfolios
Limitation:
may start pretending that extreme events in the market don’t happen.
3. Monte Carlo Simulation
This sophisticated technique uses computer simulations to estimate the possible outcome losses as a result of thousands of market scenarios produced.
Best for:
- complex portfolios
- Trading any type of derivatives or options.
Limitation:
Is very CPU-intensive
In today’s day and age, hedge funds, banks and institutional traders will typically use a variety of VaR approaches to enhance the risk assessment process during periods of market volatility.
Value at Risk Calculation Example
Let’s understand Value at Risk with a simple example.
Assume a trader has:
- Portfolio value: $1,000,000
- Daily volatility: 2%
- Confidence level: 95%
Using the VaR formula:
VaR=1.65×0.02×1,000,000
The estimated one-day VaR is:
$33,000
This means there is a 95% probability that the portfolio will not lose more than $33,000 in a single trading day under normal market conditions.
Professional traders and institutions use calculations like this to:
- manage portfolio exposure
- reduce excessive risk
- set trading limits
- improve capital allocation decisions
The higher the volatility, the higher the Value at Risk, which is why VaR increases significantly during unstable market conditions.
Conditional Value at Risk (CVaR)
Conditional Value at Risk (CVaR) or Expected Shortfall is the average loss above VaR in extreme market conditions.
CVaR is used to reflect how much loss would occur if it exceeded the VAR, whereas Value at Risk (VAR) is used to reflect the minimum amount of expected loss.
For example:
For a portfolio with a $50,000 VaR, CVaR takes into account the average loss in the worst scenarios when losses exceed $50,000.
This can improve the ability of CVaR to analyse:
- tail risk
- market crashes
- extreme volatility
- black swan events
Many institutional investors and regulators believe that Conditional VaR is a more accurate risk management tool in times of uncertainty than traditional VaR because of this enhanced understanding of downside exposure.
Advantages and Limitations of VaR
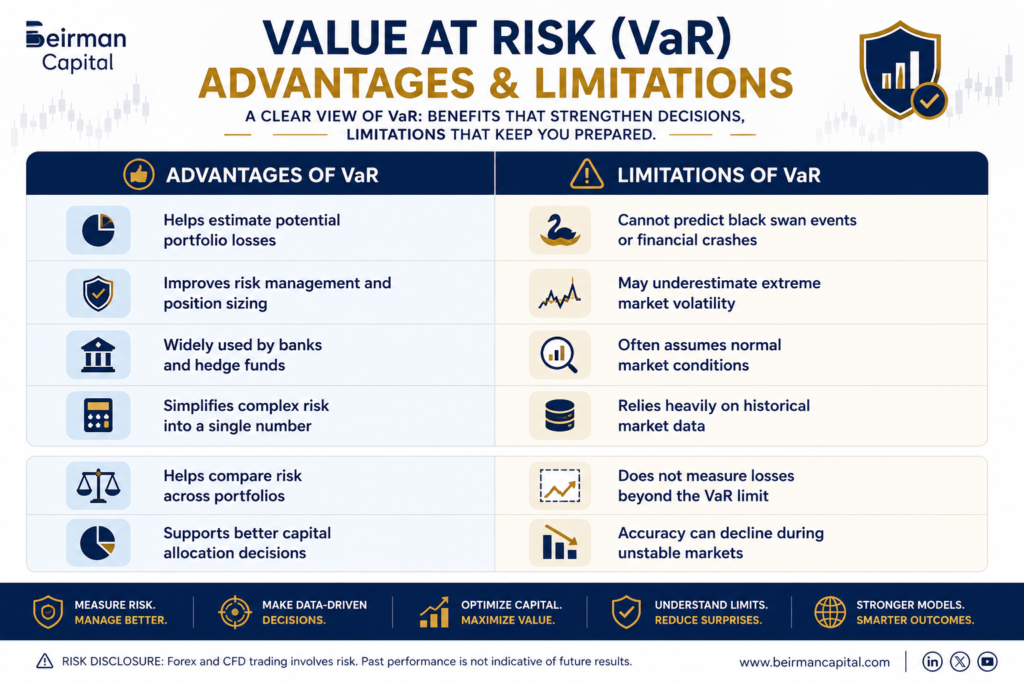
Although Value at Risk is one of the most widely used risk management tools, professional traders usually combine it with stress testing and broader market analysis to handle extreme market conditions more effectively.
How Traders and Institutions Use VaR
Value at Risk ( VaR ) is widely adopted throughout the global financial markets to estimate and manage trading exposure before it gets out of hand.
Banks and Hedge Funds
There are many large financial institutions that employ VaR to track the risk of their portfolios, administer capital and manage the losses on trades. Additionally, a lot of banks employ VaR models for regulatory risk control needs.
Forex and Stock Traders
VaR is used by traders to make the following decisions:
- position sizing
- stop-loss levels
- portfolio exposure
- leverage risk
This can help mitigate the emotional trading decisions that may be made during periods of high market volatility.
Crypto Investors
In highly volatile crypto markets, VaR is typically applied to gauge downside risk, such as during significant price fluctuations in cryptocurrencies like Bitcoin and Ethereum.
Portfolio Managers
Value at Risk (VaR ) is employed by asset managers to manage risk across various investments, sectors and asset classes and also to safeguard long-term portfolio performance.
The VaR is still one of the most popular risk management frameworks used in institutional trading in 2019, as well as in global financial analysis and portfolio management.
Conclusion
Value at Risk ( VaR ) is among the leading instruments in today’s risk management field as it assists traders and investors in anticipating prospective losses prior to entering the trading arena. It can be applied in diverse ways across the financial industry, including banks, hedge funds, and traders in the forex and cryptocurrency markets, to manage exposure, optimise position sizing, and make well-informed financial decisions.
But there’s no single risk model that can accurately forecast extreme market movements. That’s why professional traders often utilise VaR in conjunction with more comprehensive market analysis, portfolio diversification, and sound risk management approaches.
Market risk is just as critical an issue for Beirman Capital as finding trading opportunities. If you trade forex, stocks or cryptocurrencies, then employing data-driven risk management strategies can help you achieve more consistent long-term trading performance.
FAQ
The 95% Value at Risk ( VaR) is the level below which the losses of a portfolio are expected to stay 95% of the time in normal market conditions in a specified time horizon.
Value at Risk ( VaR) is a financial risk management measure to quantify the maximum loss that a portfolio/investment can incur over a given period of time and level of confidence.
10% VaR is the highest potential loss that is likely to be exceeded 10% of the time over a period of time. It represents a lower confidence level, and it also exposes to a higher risk.
The larger the VaR, the more potential losses the portfolio could suffer from if market volatility increases, position sizes become larger, or if exposure to risky assets like leveraged trades or cryptocurrencies is greater.
Value at Risk is used to measure potential losses, improve risk management, control portfolio exposure, and simplify complex market risk into one measurable value to help facilitate financial decision-making.
Some value at risk models are based on historical data and normal market conditions, which might underestimate extreme market events. It is also not the best indicator of losses above the VaR threshold.
Get Complete Forex Trading Assistance