Double Top Double Bottom Patterns: Meaning, Strategy & Real Trading Guide
Learn double top and double bottom patterns with clear meaning, strategy, entry, stop loss and examples. A practical trading guide to improve accuracy and avoid false signals.
Table of Contents
The vast majority of traders are able to identify a double top or double bottom on the chart, and still fail to trade it profitably. Why? Since it is not half the battle to realise the pattern. Most people fail at the implementation.
Market observations and studies indicate reversal patterns, such as double tops and bottoms, are much more accurate when backed up with adequate breakout and volume, but many traders are too eager, and many become victims of false signals.
This pattern recognition will not be the only thing you do in this guide by Beirman Capital. You will understand the true interpretation of these constructions, the psychology behind them, and most importantly, how to trade them using the clear entry, stop loss and target strategies.
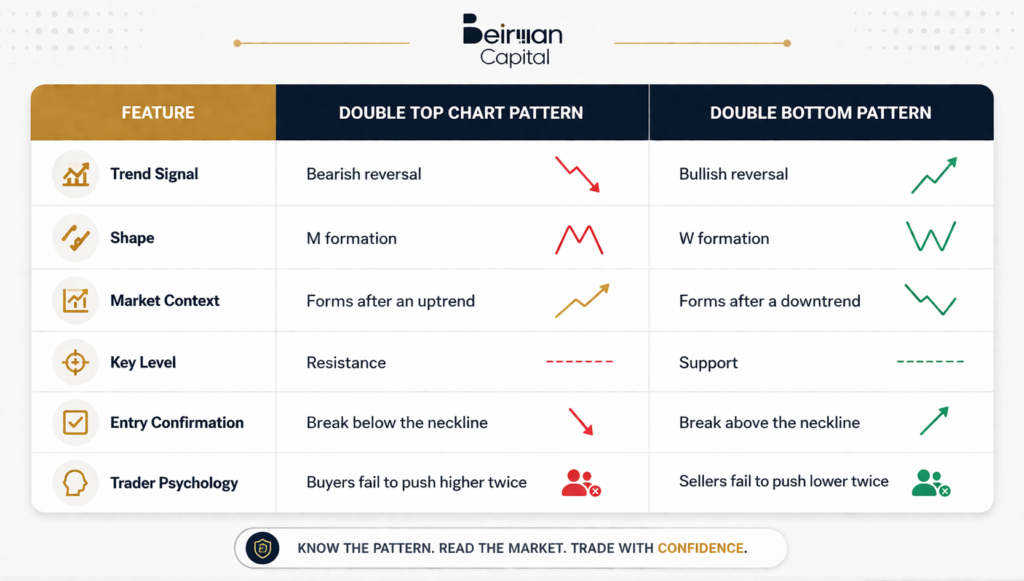
Double Top vs Double Bottom Chart Patterns
Before moving into strategy, it is important to clearly understand how these two patterns differ. Many traders identify the shapes correctly but misinterpret what the market is actually signalling, which often leads to poor trade decisions.
The comparison below simplifies both patterns into actionable differences:
Why This Difference Matters in Real Trading
On the surface, both designs seem to be mere mirror images. But the true worth is to know what they are all about under the building.
A double top is a market in which the buying pressure is declining. Price tries to overcome resistance on two occasions but fails, which means that sellers are slowly gaining momentum.
Conversely, a double bottom pattern is an indication that the selling pressure is disappearing. There are two solid price support levels, implying that buyers are intervening with growing confidence.
It is this reversal of power between the buyer and the seller that generates the trading opportunities. The pattern turns out to be merely a shape and not a tool for choosing without knowing this.
Key Insight for Traders
Among the most frequent ones is the action preceding the confirmation of the pattern.
A good trade arrangement is established once the neckline is definitely torn. Up till that time, both tendencies are incomplete and may easily become false indications.
That is why disciplined traders are not so concerned about the pattern but wait until they get confirmation to enter a trade.
Double Bottom Pattern: Meaning and Structure
A double bottom refers to a reversal pattern of the downtrend that is bullish. It implies that the selling pressure is losing strength, and the market can go up once it is confirmed.
The pattern is developed when price develops two similar lows at a strong support level, which gives the chart a W shape.
The following is the development:
- Price declines and makes the initial bottom.
- It is bounced, which results in a level of resistance (neckline).
- The price falls once again but does not reach the old low.
- The pattern was confirmed by a breakout above the neckline.
The point of this trend is quite straightforward. Buyers are beginning to gain control as sellers attempt to drive the price to a lower level twice, to no avail.
The trend, however, can only be true when there is a noticeable burst above the neckline. Premature entrance can give a lot of misleading messages.
How to Trade Double Top & Double Bottom Patterns (Step-by-Step Strategy)
Understanding the pattern is only the first step. The real edge comes from how you execute the trade. Most losses happen because traders enter too early or ignore confirmation.
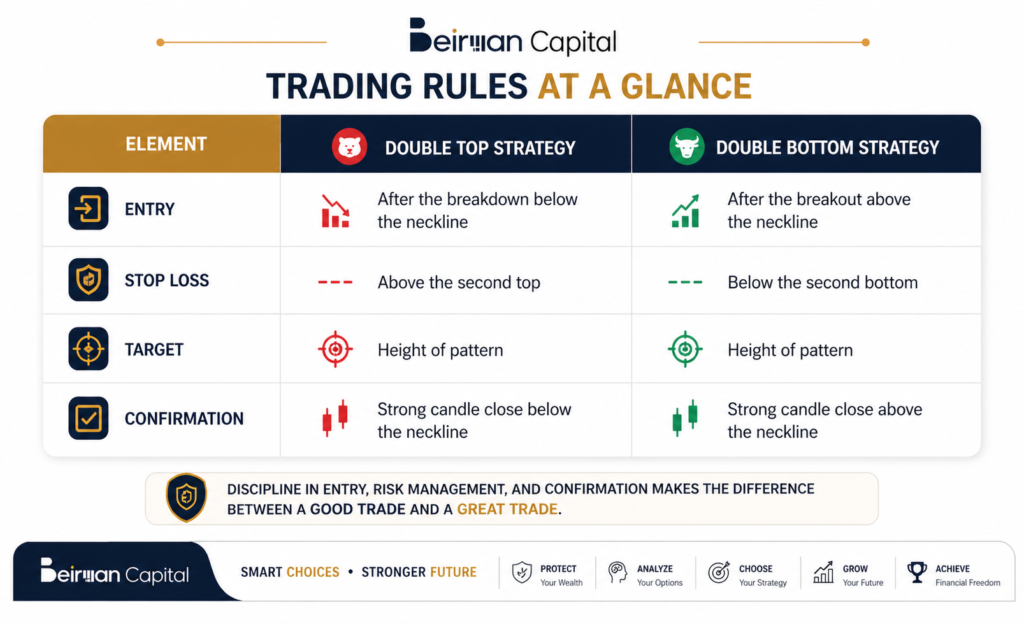
Entry Rules (Where Most Traders Go Wrong)
The biggest mistake is entering at the second peak or second bottom.
A valid trade only forms when:
- Price breaks the neckline
- The move shows clear momentum (strong candle close)
Until then, the pattern is incomplete and can easily fail.
Stop Loss Placement (Protecting Your Capital)
Risk management is what separates consistent traders from the rest.
- For a double top, place your stop loss above the second peak
- For a double bottom, place it below the second low
This ensures you exit the trade if the pattern fails.
Target Calculation (How to Set Profit Levels)
The most reliable method is the pattern height approach:
- Measure the distance between the top/bottom and the neckline
- Project the same distance from the breakout point
This gives you a logical and structured profit target instead of guessing exits.
Confirmation Checklist (High-Probability Setup)
Before entering any trade, make sure:
- The pattern is clearly visible
- The neckline is properly defined
- A strong breakout has occurred
- Market conditions are not highly volatile
This simple checklist can filter out a large number of low-quality setups.
Practical Insight
These patterns work best when combined with discipline. Waiting for confirmation may feel slow, but it significantly improves trade accuracy.
Professional traders focus less on predicting and more on reacting to confirmed price action. This approach helps avoid unnecessary losses and builds long-term consistency.

Real Chart Examples of Double Top & Double Bottom Patterns
Understanding the theory is important, but real clarity comes when you see how these patterns behave in actual market conditions. The goal is not just to identify the pattern, but to understand when it becomes tradable.
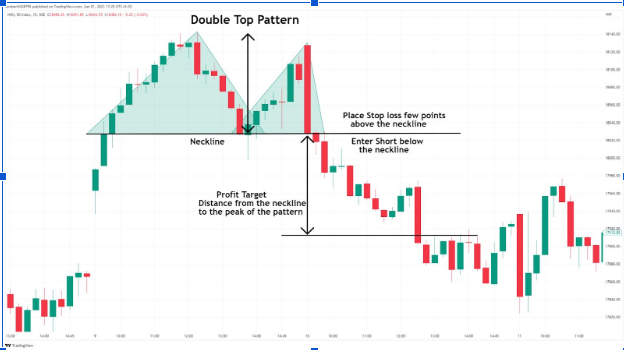
Double Bottom Example (Bullish Reversal)
A typical double top arrangement consists of the price trend in a strong upswing and the creation of a higher price level. Following a pullback, it tries to go up once more but cannot overcome the resistance point that it had reached.
This failure forms the second top.
The turning point is the time when the price falls out of the neckline decisively. This failure proves that the market is no longer controlled by buyers, but sellers are now dominating the market.
One of the pitfalls in this case is to get in at the second peak. In practice, the higher-probability trade is only revealed after the verified failure, not before.
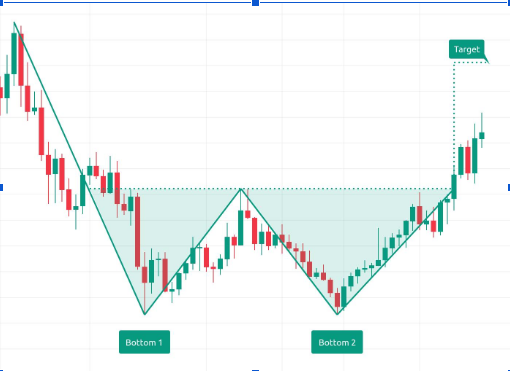
Double Bottom Example (Bullish Reversal)
In a double bottom pattern, the price is in a downward trend, and first a low is formed, after which there is a recovery. It then goes back to the same level of support and does not break below.
This forms the second bottom.
Only when the price breaks above the neckline with momentum is this trend validated. This breakout shows that the selling pressure has been reduced and buyers are intervening.
Traders who move in prior to the breakout are likely to be trapped in case the support breaks out.
What You Should Focus on While Observing Charts
Instead of just spotting shapes, train yourself to look for:
- Clear support and resistance levels
- Strong breakout or breakdown candles
- Clean pattern structure (avoid messy charts)
The cleaner and well-defined the pattern, the higher the probability of a successful trade.
These examples highlight one important idea:
Patterns do not work because of their shape, but because of the shift in control between buyers and sellers.
Common Mistakes Traders Make with Double Top & Double Bottom Patterns
Entering too early:
There are false signals and avoidable losses that are caused by taking trades in advance of the neckline break.
Ignoring market context:
These patterns are most effective when there is evident direction and not in a sideways market or choppy markets.
Misidentifying the pattern:
None of the “M” or “W” shapes is valid. Lack of strong structures in support or resistance tends to cause collapse.
Poor risk management:
Missing the stop loss or taking excessive risk may make even a good set-up a loss.
Chasing late entries:
Late movers lessen the risk-to-reward and lessen profit potential.
The trick is to be confirmation-oriented, organised, and disciplined in execution and not merely pattern-recognition oriented.
Pro Trading Tips to Improve Pattern Accuracy
Concentrate on longer periods:
The 4H, daily or weekly charts tend to be more accurate with the use of double top and bottom patterns than the lower charts.
Wait until a good breakout:
Stronger and faster breakouts are better than weak or slow breakouts.
Make use of Confluence to be more precise:
Integrate the pattern with such tools as support and resistance, trendlines or such indicators as RSI.
Do not trade when significant news is on:
The volatility may be high and provide a fake breakout and nullify the pattern.
Choose clean chart structures:
Well-defined and clear patterns work better than price action that is messy or overlaps.
Risk management: stick to it:
Always set your stop loss and have an adequate risk-to-reward ratio.
Good setups and good execution yield consistent results, and not trading all patterns you see.
Limitations of Double Top & Double Bottom Patterns
These patterns are useful, but they are not foolproof. Treat them as probability-based setups, not guarantees.
False breakouts
Price may temporarily slip out of the neckline and turn around, catching an early exit.
Market conditions matter
With low volume or sideways patterns, patterns do not often have a strong follow-through.
Confirmation is essential
The arrangement is not complete and does not guarantee reliability without a firm close above the neckline.
Subjective identification
Not every shape of M or W is good. The inconsistent trades may occur due to different interpretations.
No guaranteed outcomes
Even clean patterns may break down, hence the necessity to have defined risk management where no compromise is possible.
These patterns are effective in the long-term due to the disciplined approach of confirmation and risk control.
Quick Checklist Before You Trade Double Top & Double Bottom Patterns
Be sure that these conditions are satisfied before engaging in any trade:
- Well-defined top or bottom at certain levels and a clear pattern structure.
- Neckline is either referred to as support (double top) or resistance (double bottom).
- A breakout that is confirmed with a solid candle that extends beyond the neckline, not just a wick.
- Patterns follow an obvious trend, not in a sloping or jagged market.
- Favourable risk-to-reward depends on the pattern height.
This checklist is a basic filter. In the case that any of these conditions is not met, it is preferable to wait until a good trade is obtained, as opposed to a bad trade.
Conclusion
The techniques of the double top and double bottom are effective in identifying possible market reversals, but it is up to you to use the tools effectively. It is not sufficient to realise the pattern. Waiting until certain, choosing clean setups and using appropriate risk management will yield consistent outcomes.
Traders who are more disciplined than predictive are more likely to outperform in the long-term. These patterns may be incorporated into your trading strategy, which is why they require both organisation and psychology and a set of rules to follow.
At Beirman Capital, there is an emphasis on trading based on strategy and not speculation. Using the same line of thinking, you will be able to prevent making typical errors and enhance general decision-making in the market.
FAQs
Unless there is a bullish double-top pattern. It is a bearish reversal pattern which indicates the weakening of buying power and may indicate a change in an uptrend to a downtrend.
A chart pattern that can be used to analyse a possible bearish reversal of an uptrend is called a double top, which occurs when the price reaches two similar highs in resistance and cannot rise any further.
The 3-5-7 rule is a risk management principle that traders use to restrict risk per trade, cumulative exposure and cumulative losses in order to ensure consistency and preserve trading capital.
Reverse chart patterns are double top and double bottom. A double top is used to signal a bearish reversal when the price is rising, and a double bottom is used to signal a bullish reversal when the price is falling.
A bearish pattern is called a double top. It demonstrates that price has not managed to overcome resistance on two occasions, which means that buyers have been weakened, and the chances of a downward movement are high.
Yes, a bottom is two times, and this is a bullish indicator. It exhibits good support at 2 times, indicating that sellers are losing control and buyers are able to push the price higher.
When backed up by a neckline breakdown and good context, the double top pattern can be dependable, but as with all patterns, the pattern is not always right and may give false alarms.
Get Complete Forex Trading Assistance