Bullish Harami & Harami Candlestick Patterns | Haramich Guide
Bullish harami is a harami candlestick pattern signaling a bullish reversal. Learn how to trade it, spot haramich setups, and avoid bearish harami traps.
Table of Contents
Have You Ever Traded a Bullish Harami Candlestick Pattern?
Well, the term may look quite weird, but the bullish harami candlestick pattern undoubtedly gets placed among the top bullish candlestick patterns used by professional traders.
Wait, you don’t know how to use the bullish harami candle? Not to worry. In this Beirman Capital’s candlestick education series, we will today discuss the bullish harami pattern, how to use it with diverse strategies, its pros and cons, and how it fits into both bullish and bearish candlestick patterns.
What is a Bullish Harami?
A bullish harami is a popular Japanese candlestick pattern that indicates a potential for a bullish reversal. It consists of two candles one large and one small and the second is completely within the body of the first candle.
A bullish harami candlestick pattern forms when the bears are in control, but the bulls manage to weaken the trends. It suggests to traders a potential for a price rise and signals they should open a long position in the asset. It’s among the most reliable bullish candle pattern charts.
How to Spot a Bullish Harami Pattern
Struggling to identify a bullish harami pattern on the chart? Let us look at how to do so.
Shape: The word ‘Harami’ means pregnant in Japanese. That’s why the harami candlestick is often called the pregnant lady candle because it looks like a woman with a womb.
Candle: The bullish harami consists of two candlesticks: the first one is long and bearish (red), and the second one is short and bullish (green). The body of the second green candlestick lies entirely within the big red candlestick, forming the harami pattern.
Trend: A bullish harami candle generally appears at the end of a downtrend, signaling a bullish market chart reversal. It is one of the foundational bullish and bearish candle patterns.
How to Trade the Bullish Harami Pattern
1. Watch the Trend and Identify the Pattern
You first need to monitor the existing trend. A bullish harami pattern appears during the end of a downtrend, so stay alert. Look for two candles forming the harami candlestick pattern with the characteristics mentioned above.
2. Check the Volume
Don’t rush into a trade when a harami forms. Always check volume. A bullish harami candlestick pattern accompanied by rising volume confirms its strength.
3. Plot Trading Indicators
Never trade solely on a bullish harami signal. Use supporting indicators such as RSI (Relative Strength Index), Fibonacci retracement, and Moving Averages. This enhances the reliability of the candle pattern bullish setup.
4. Open a Long Position
Once the pattern is confirmed with volume and indicators, open a buy position. Place the take profit and stop loss levels according to your risk-to-reward ratio. The bull cross candlestick meaning here is a clear sign of reversal. Use an R/R ratio of 1:3 for better results.
Bullish Harami Pattern Strategies
Traders can use the bullish harami pattern in different ways. Want to know how? Here are the strategies to trade these candlesticks:
Bullish Harami and RSI
A bullish harami paired with RSI under 30 suggests oversold conditions. Both the bullish candle and technical indicator point to a reversal.
Bullish Harami and Moving Averages
Combine it with the golden cross strategy where the 50-day MA moves above the 200-day MA. This setup with a bullish harami candle strongly favors a trend reversal.
Bullish Harami and Bollinger Bands
When the middle Bollinger Band touches the lower band, it confirms oversold levels. If a bullish harami forms here, it’s an excellent entry point.

Bullish Harami and Fibonacci Retracement
Use the Fibonacci’s golden ratio strategy levels 38.2% and 61.8%. If the bullish harami appears near these levels, it’s a strong bullish candle pattern chart signal.
Bullish Harami and Other Patterns
You can pair bullish harami with supportive patterns like hammer, morning star, or even another bullish harami. These patterns bullish enhance confidence.
Advantages of Bullish Harami Pattern
- Simplicity: Only two candlesticks, one large red (bearish candle) and one small green (bullish candle). Easy to spot, especially for beginners.
- Compatible: Can be used with RSI, Fibonacci, Bollinger Bands, and other bullish and bearish patterns.
- Versatility: Works across stocks, crypto, commodities, forex, and ETFs.
- Clear Signals: Offers a straightforward bullish vs bearish candles interpretation—bulls may be gaining control.
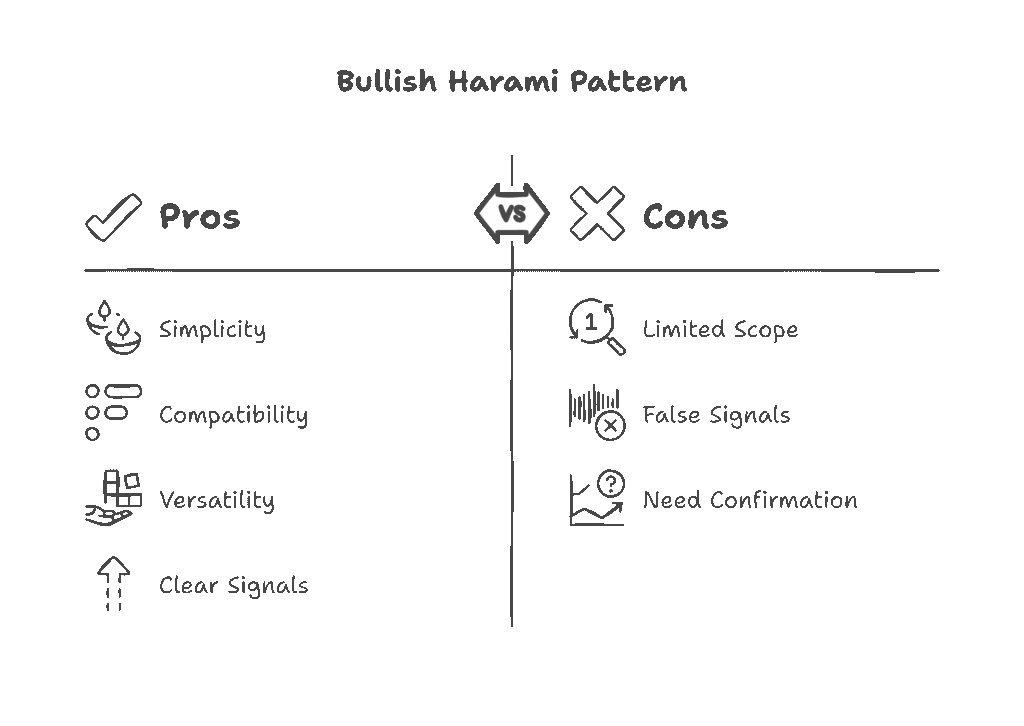
Disadvantages of Bullish Harami Pattern
- Limited Scope: As a two-candle pattern, it’s best for short-term trades and not ideal for long-term investing.
- False Signals: In choppy markets, the pattern can be misleading, especially without volume confirmation.
- Need for Confirmation: Must be supported by technical indicators and candlestick characteristics to avoid false breakouts.
Bullish vs. Bearish Harami
You can confuse a bullish or bearish pattern with each, as they look exactly the same, but the interpretation is different. Let us compare both patterns to understand the difference:

- A bullish harami forms at the bottom of a downtrend. The first candle is bearish, the second is bullish fully within the previous body. Indicates a bullish reversal.
- A bearish harami candlestick pattern appears at the top of an uptrend. The first candle is bullish, the second is bearish and within the first candle’s body signaling a bearish reversal.
Both follow the harami meaning in Japanese, symbolizing something “within” just like a pregnant lady candle. The bearish candlestick, or haramich, signals the bears are regaining control.
Wrapping Up
No trading pattern is flawless. But with the bullish harami candlestick pattern, your approach makes all the difference.
Understand the harami meaning, master candlestick characteristics, and always validate with technical indicators. Be cautious with green red patterns, and avoid emotional trading.
Want to try the bullish harami strategy in live markets? Open an account with Beirman Capital and trade with industry-leading tools. Perfect your craft using proven bullish and bearish candlestick charts.
FAQ
- What does a bullish harami mean?
A bullish harami is a Japanese candlestick pattern where a small bullish candle follows a large bearish candle, signaling a potential trend reversal. - What happens after bullish harami?
It usually indicates a shift from bearish to bullish trends, encouraging traders to open buy positions. - Is the bullish harami reliable?
Yes, especially when validated with volume, RSI, moving averages, or other bullish candlestick patterns. - What does a bearish harami pattern indicate?
The bearish harami signals a downtrend reversal, suggesting traders take a short position. - How accurate is bearish harami?
Its accuracy increases with proper confirmation from candlestick patterns bearish and technical tools. - Which is more bearish—harami or doji?
The bearish harami is more decisively bearish, while a doji suggests market indecision.
Get Complete Forex Trading Assistance