Japanese Candlesticks Patterns
A Japanese Candlesticks Chart shows the price movement of the financial asset over a period. Learn about its concept and how to read it with popular types.
In the trading world, you may have come across a person obsessed or addicted to charts. However, that is not rare; traders love candlesticks as these technical analysis tools provide valuable market insights. This article will teach you the concept of the most popular Japanese Candlestick patterns, including hammer candlestick pattern, shooting star candlestick, and more. You’ll also find candlestick chart cheat sheets, downloadable candlestick patterns PDFs, and reversal patterns to sharpen your skills. So stay tuned.
Charts are the medium to understand the price pattern of a particular asset over time. These help traders in making trade decisions based on technical analysis and reversal candlestick patterns, especially when combined with tools like the candlestick chart cheat sheet and trading patterns cheat sheet.
There are three major types of charts: line, bar, and candlestick. Line and bar are the oldest forms of charts. Meanwhile, candlestick patterns including popular types such as the hammer candlestick pattern, shooting star candlestick pattern, and reverse hammer are a modern and more intuitive approach for trading. Each of these candle options belongs to the broader family of types of candles or candle types used in charting.
Introduction to Japanese Candlesticks charts
A Japanese Candlesticks chart is made up of individual candelsticks or trading sticks that reflect price action. It shows the highs, lows, openings, and closings over a specific period. Among them, patterns like the bullish hammer candlestick, small hammer, pattern hammer, hammer and inverted hammer, upside down hammer candlestick, and hammer hammer are particularly noted for their ability to signal bullish hammer or reversal candles.
As the name suggests, Japanese candlestick charting originated in Japan around the 17th century. The technique was developed by Homma Munehisa, a rice trader, to analyze rice price movements. Due to their effectiveness, these candle types quickly became popular in the Western world. Also, Steve Nison’s book on Japanese Candlestick trading and his discussion on candlestick color, such as white and yellow candles, further contributed to their popularity—especially with patterns like the shooting star candlestick and the hanging man reversal.
Today, these patterns are widely used in trading forex, stocks, commodities, and cryptocurrencies and are often referenced in candlestick patterns PDF guides for in-depth learning.
How to read Japanese Candlestick Patterns
Reading candlestick is an art that requires a basic understanding of these price patterns. Beginners may find difficulty in interpreting candlesticks. However, these are the simplest charting tools. Let us understand its components for a better understanding:
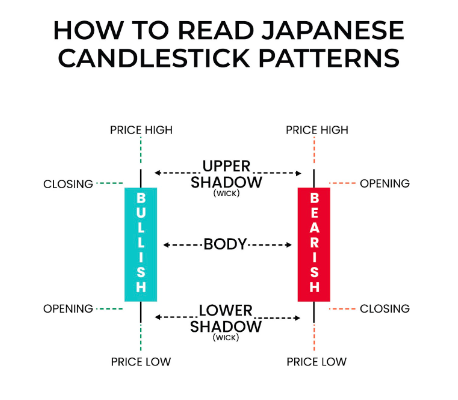
Body
A body represents the thickest part or rectangular area of the candlestick that shows the opening and closing price over a specific period, depending on the chart’s time frame.
The candle form can be long, short or medium, depending on the difference between opening and closing price. The higher the difference, the bigger the candle; the lower the difference, the smaller the candle.
Colour
Another crucial component to understanding the price pattern and the overall trend is the candle’s colour.
Generally, white and green colours are used to indicate the rise in the asset’s price. Meanwhile, a red and black candle indicates the fall in the asset’s price.
In the bullish candle, the top of the body represents the closing price, and the bottom is the opening price. Meanwhile, in the bearish candle, the top represents the opening, and the bottom represents the closing price.
Shadow
A shadow is also known as a wick or tail. It is an extended line above and below the Japanese candle used to denote the highest and lowest prices.
Upper shadow
The top wick represents the highest price traders are willing to buy the asset during the period.
Lower Shadow
The low wick or candle’s tail represents the lowest price traders are willing to sell during the period.
Top Japanese Candlesticks patterns.
Top Japanese Candlesticks patterns
Different types of candles are formed in a chart to show the prevailing price movement. Each candle gives valuable insight to the traders. So here are some top Japanese Candlestick that helps you in taking your financial trading journey to the next level.
Doji: Neutral
A Doji is a small dojo candle formed when there is a very small difference between the opening and closing price over a period. It indicates indecision among buyers and sellers, often highlighted through doji candlestick analysis. Many traders refer to what size body is a doji cabndle and what is the wick range of a doji candle to classify its types accurately
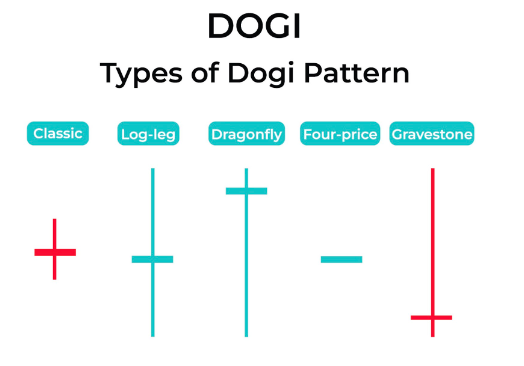
Classic or Standard Doji
A small body candle with a small wick and tail indicates indecision. This includes the doji star, doji star bullish, and various bullish doji candlestick or bullish doji candle setups.
Long-Legged Doji
A small body candle with a long wick and tail indicates strong indecision. This falls under the spinning candle, spinning top candle, spinning top candlestick, and spinning tops candlestick pattern or candlestick patterns spinning top family.
Dragonfly Doji Candle
A small body with a long lower wick and with little or no upper wick indicates a bullish reversal. This is commonly referred to as the dragonfly doji, dragonfly doji candlestick, dragonfly doji candle, or dragon fly doji. It’s also seen as a bullish dragonfly doji, doji dragonfly, doji dragonfly candlestick, dragonfly candlestick, dragon fly doji candlestick pattern, dragon fly doji candlestick, bullish doji, or even drangonfly doji. Traders often question, “dragon fly doji means” or seek its dragonfly doji meaning in trend reversals.

Gravestone
A small body with a long upper wick and little or no lower wick indicates a bearish reversal. This type includes gravestone doji, doji gravestone candlestick, tombstone doji, and is often discussed in reversal doji candlestick patterns.
Four Piece Doji
A small body with no wick occurs when opening, closing, high, and low prices are the same. This might appear in rare chart instances and resemble a pure doji or hammer doji, with some characteristics overlapping with bearish dragonfly doji formations.
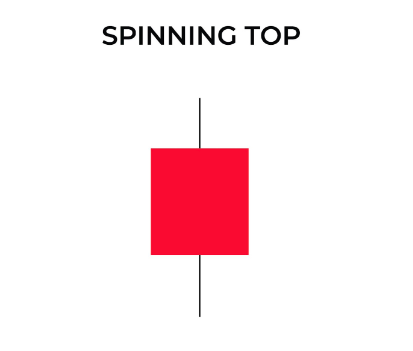
Spinning Top: Neutral
The spinning top is another neutral pattern in Japanese candlestick charting that traders often use to assess market uncertainty. This spinning top candlestick pattern is easy to identify it features a small candle body with a long upper wick and lower tail, resembling a classic spin candle. The spinning top candlestick formation represents indecision between buyers and sellers, often showing up during price consolidation or hinting at a possible trend reversal.
While analyzing this setup, traders often wonder what size body is a doji cabndle, since spinning tops and doji patterns share similarities in structure and meaning.
However, the key difference lies in the slight body present in spinning tops.
There are different forms of this pattern: a bullish spinning top may suggest an upward reversal after a downtrend, while a bearish spinning top can signal a potential drop following a rally. These variations fall under broader candlestick patterns spinning top and spinning tops candlestick pattern categories, often discussed in technical analysis. Whether labeled as a spinning top candle, spinning top candlestick, or candlestick spinning top, it remains a crucial part of reading market sentiment and planning entry or exit points.
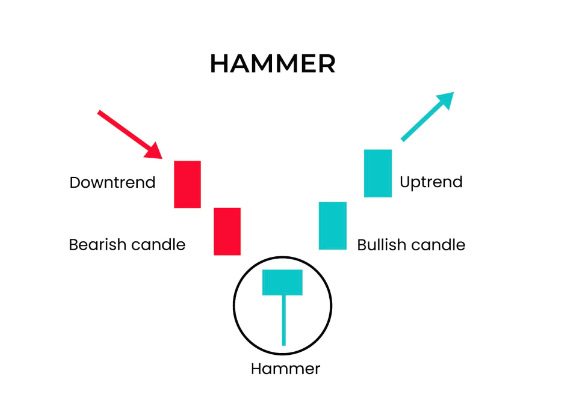
Hammer: Bullish
As the name suggests, the hammer is a candlestick pattern that looks exactly similar to a hammer. The candle has a small body and a long lower wick. Usually, it shows that the price reached new lows; however, the buyers managed to reverse the bearish trend.
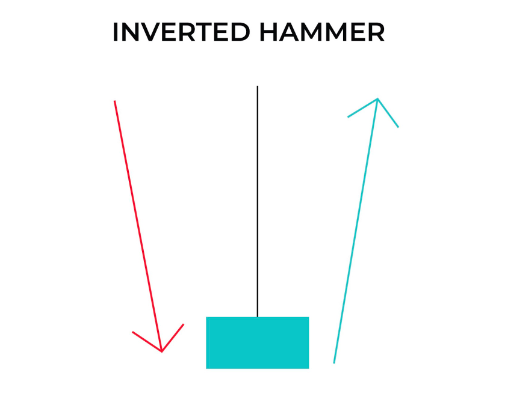
Inverted Hammer: Bullish
An inverted hammer is quite similar to a hammer. However, the wick makes the difference. The candle has a small body and a long upper wick. It occurs during the downtrend and indicates trend reversal or bullish sentiment. It suggests that the bears pushed the price; however, buyers managed to reverse the trend.
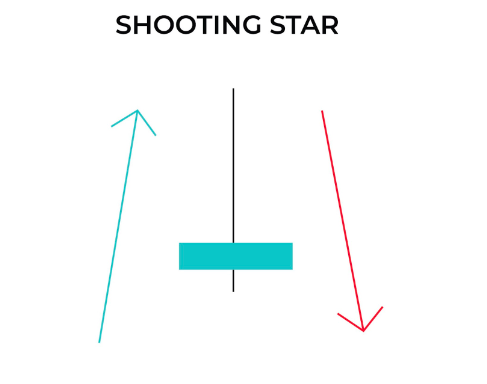
Shooting Star: Bearish
The shooting star candlestick looks quite similar to an inverted hammer, featuring a small body and a long upper wick. However, the trend makes the whole difference; the shooting star pattern occurs during upward trends and signals a potential trend reversal from bullish to bearish. This makes the shooting star candlestick pattern a powerful indicator for traders watching for signs of weakening buying pressure.
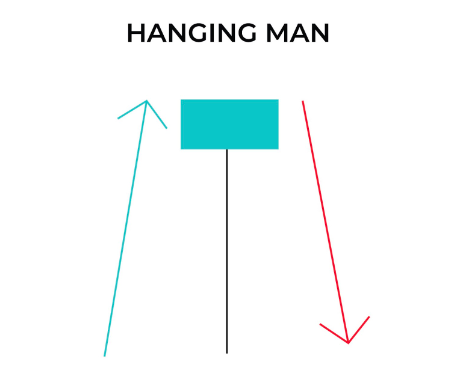
Hanging Man: Bearish
Hanging Man is also regarded as an inverted shooting star. It has a small body, and a long lower wick occurs during an uptrend, signalling a bearish reversal. It shows that despite the pressure from the bulls, bears have entered the market and pushed the price back.
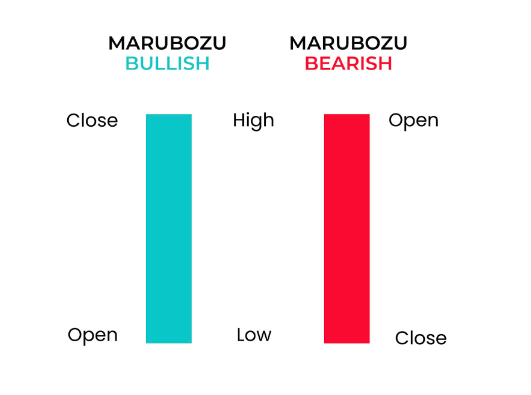
Marubozu: Bullish/Bearish
Marubozu, also spelled marubuzo, is also known as a shaved head candlestick pattern or bald Japanese candlesticks trading pattern. This formation is represented by a long candle with a big body and no upper or lower wick, commonly referred to as the marubozu candle. The marubozu candlestick or marubozu candle pattern signals a strong continuation of the ongoing trend.
Candlestick patterns marubozu are easy to spot, especially in strong momentum markets. A bullish marubozu indicates continued buying pressure, while a bearish marubozu suggests further selling. These marubozu candles are significant because they occur when the highs and lows are nearly the same as the opening or closing price, leaving no shadows—hence the term marabozu candle.
Bullish marubozu
It occurs when the opening price equals the low cost, and the closing price equals the high price. When it forms during an uptrend, it indicates a continuation of the trend, while when it forms during a downtrend, it suggests a trend reversal.
Bearish marubozu
It occurs when the opening price equals the high price, and the closing price equals the low price. When it forms during a downtrend, it suggests trend continuation; when it forms during an uptrend, it indicates trend reversal.
Engulfing: Bullish/Bearish
Engulfing is a two-candle pattern where one candle engulfs the body of another candle. This engulfing candle generally signals trend reversals and is widely used in technical analysis. The engulfment definition refers to a larger candle completely covering the previous candle’s body within a price chart.
There are two types of engulfing: the bullish engulfing candle, also known as the bull engulfing pattern, which suggests a shift from a downtrend to an uptrend, and the bearish engulfing candle, which indicates a reversal from an uptrend to a downtrend. In trading psychology, the fear of engulfment can cause hesitation among traders when identifying potential reversals.
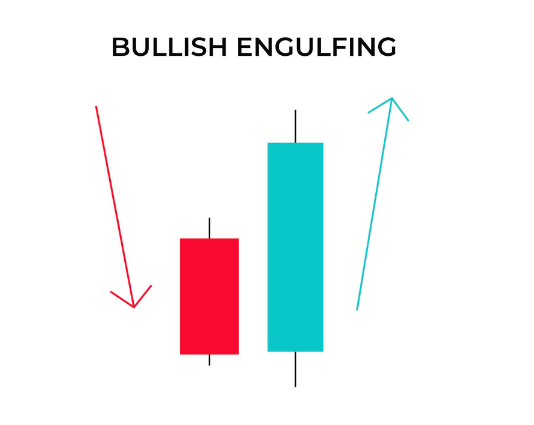
Bullish Engulfing
It occurs when a second large green candle engulfs a first small red candle. The candle indicates a trend reversal from bearish to bullish.
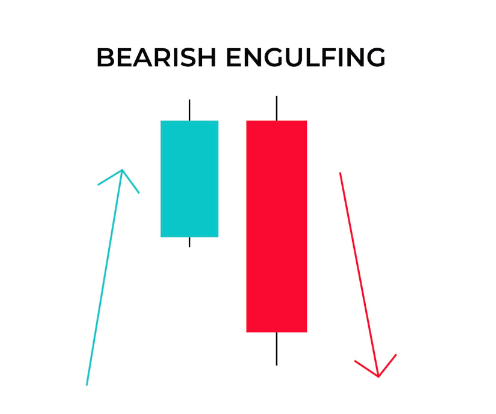
Bearish Engulfing
It occurs when a second large red candle engulfs a first small green candle. The candle indicates a trend reversal from bullish to bearish.
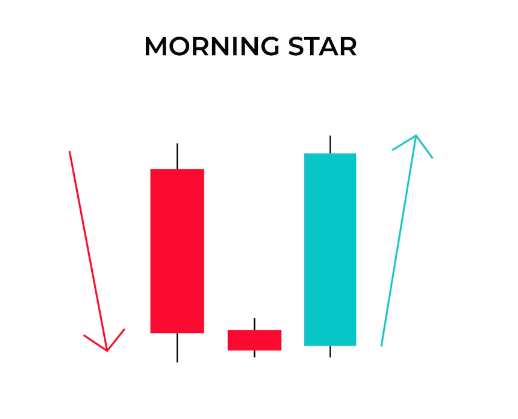
Morning Star: Bullish
A morning star candlestick pattern is a three-candle formation that signals a potential bullish reversal in the market. In the morning star pattern, the first candle is a long bearish candle, indicating a continuation of the downtrend. This is followed by a short spinning top or doji candle, reflecting indecision among traders. The third candle is a long bullish one, marking the end of the downtrend and the start of an uptrend.
This morning star candlestick formation is considered a reliable reversal signal, especially when it appears at the bottom of a downtrend. The structure of the morning star candle offers a clear visual representation of weakening bearish momentum and strengthening bullish sentiment
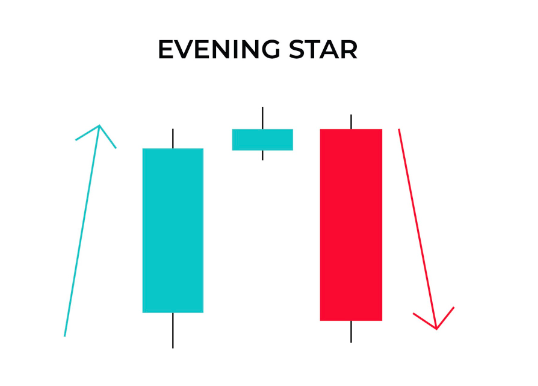
Evening Star: Bearish
The evening star candlestick pattern is quite similar to the morning star. However, it indicates exactly the opposite situation. The evening star pattern occurs when the first candle is a long bullish candle, followed by a short spinning top or doji candle, and the third one is a long bearish candle.
This evening star candle formation signals a shift from bullish market sentiment to bearish. It shows that buyers have lost control over the market, and sellers have managed to push the price downward, indicating a potential trend reversal.
Wrapping Up
Japanese Candlesticks trading is amongst the best way to identify the right opportunities and time for trading. The patterns are simple and easy to understand and interpret.
However, making your decision solely based on these patterns is not a good idea. Also, these charts may result in subjective or false interpretations.
Therefore, combining it with technical analysis indicators is t / he best way to use it. Also, consider fundamental analysis conditions like news, economic events, announcements or speeches before making the trade decision.
Get Complete Forex Trading Assistance