Technical analysis of the financial markets
Learn the concept of technical analysis of the financial markets with examples. Discover its key components, indicators, advantages & disadvantages.
Have you ever come up with a person who loves technical analysis? Well, you may have, as many traders in the financial markets are obsessed with technical analysis. So, in this article, let us discuss the technical analysis of the financial markets—along with its components, such as moving average and Fibonacci bands, and its pros and cons.
Understanding Technical analysis of the financial markets
Technical analysis is the evaluation and examination of statistical data, information, & chart patterns to spot potential buying and selling opportunities in the financial market.
Have you ever heard of the phrase, “History tends to repeat itself”? Technical analysis is based on this concept only.
Technical analysts believe that the price of financial assets tends to repeat history. Therefore, they watch historical price patterns to make the trade decision.
Technical analysis is used for trading currencies, stocks, cryptocurrencies, commodities, and other financial assets. However, its importance in the forex market is unmeasurable. Let us have a look at the forex technical analysis example.
Suppose a trader is trading in a USD/GBP pair. The current price of the currency pair is 0.78. You have observed that whenever the price reaches 0.75, it takes a reverse and starts rising.
When the price reaches this level, you have set a trading order for buying the pair. Suppose the price reaches that key level; in this case, if it falls further, you will suffer a loss, and if it takes a reversal, then you will make a profit.
Components of Technical Analysis in Forex
The scope of technical analysis of the financial markets is unmeasurable, with too many indicators, chart patterns, moving average and fibonacci bands indicators and tools. For a better understanding, let us study the key components that make this analysis so accurate.
Trends
Trends are amongst the most important components of technical analysis in forex. Many people believe the trend is traders’ friend; they study the price trends of assets to make buying and selling decisions.
A trend is a measure to determine the direction of the price flow of the asset. Here are three major types of trends that help traders in organizing technical analysis of financial assets:
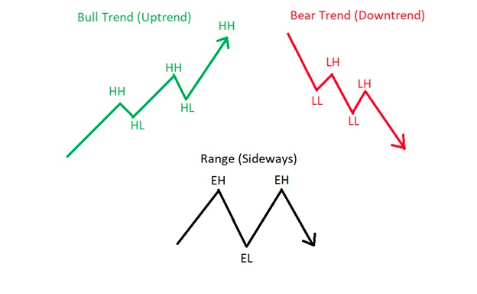
Upward Trend
When the price of the asset continuously rises
Downward Trend
When the cost of an asset constantly falls
Sideways Trend
When the asset price moves in the consolidated range without clearly showing upward or downward movements.
Support and resistance
These are the crucial pivot points that help traders identify price reversal, consolidations, overbought, and oversold conditions.
Support is the critical level where the downward trend is expected to stop, and the price starts moving upward.
Resistance is the critical level where the uptrend is expected to stop, and the price starts moving downward.
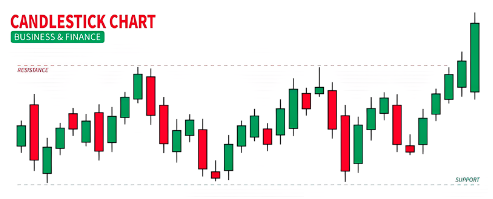
Chart Patterns
The trading chart is like the heart of technical analysis, and candlesticks are like the heartbeats. Charts are the basis to spot opening, closing, and the high and low prices of a particular period.
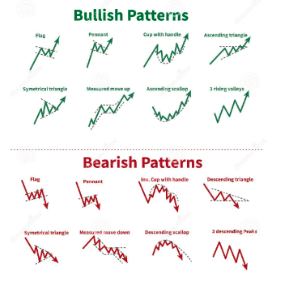
Candlesticks are used to show the asset’s price movement over a period. These candlesticks form different patterns, including head and shoulders, double tops and bottom, triangles, rectangles, wedges, flags, engulfing, hammer, etc. These patterns help traders in making trade decisions.
Technical analysis Forex Indicators
Trading indicators are the most crucial components of technical analysis in forex. These indicators are mathematical calculations that generate signals considering historical price patterns. There are numerous indicators; let us discuss the major ones:
Moving Averages
These are the most widely used technical analysis indicators to generate buy and sell signals to spot existing trends and price reversals.
Under this, trade signals are generated based on moving averages of shorter time frames like 5, 10, and 20 and longer time frames like 50, 100, and 200. Prices above the moving averages suggest bullish pressure, while below the moving averages suggest bearish pressure.
Oscillators
Oscillators are another popular indicator for conducting technical analysis of financial markets and helping to determine trend reversal, overbought, and oversold conditions. It constructs high and low bands within a specified range.
Relative Strength Index (RSI), commodity channel index, stochastic oscillators, and moving average convergence divergence are popular oscillators for currency trading.
Bollinger Bands
Bollinger bands are another crucial indicator that depicts two standard deviations above and below the moving averages. There are three bands: higher, middle, and lower.
The higher and lower bands can also be seen as the resistance and support levels. Also, Bollinger bands help determine volatility, entry, and exit points.
Fibonacci Retracements
The Fibonacci retracement is a mathematical sequence that uses horizontal lines to depict key trade levels that help traders make buying and selling decisions.
Fibonacci is amongst the most popular technical analysis forex indicators that use major Fibonacci ratios, including 23.6%, 38.2%, 61.8%, 78.6%, etc, to generate significant trade signals.

Advantages of Forex Technical Analysis
Organizing Technical analysis of the financial markets is very helpful, and if used effectively, it can give you significant returns. Let us quickly discuss its benefits:
Number never lies
The interpretation of Technical analysis is based on statistical and historical data of the asset’s price.
Also, as discussed above, mathematical indicators are used to analyze the market. So, this analysis generates the most accurate signals if used properly.
Beginner Friendly
Technical analysis can be the right choice for beginners. It is more about indicators and tools, while fundamental analysis deals with every economic and noneconomic factor that affects the financial asset’s price.
So, fundamental analysis requires a deep understanding of economic, geopolitical, and social factors and what impact they make on the currency pair’s value.
Advance tools
One of the best parts of technical analysis is that many charting tools, automated software, and trading platforms are available on the internet.
Also, several platforms provide technical analysis for free. In addition, one can also refer to technical analysis interpretation on this platform.
Disadvantages of Forex technical analysis
Well, if you are thinking of starting trading using technical analysis, then there are some limitations you need to know; otherwise, it will affect the whole results. Let us quickly discuss these:
Not sufficient
One cannot purely rely on technical analysis in forex for making trade decisions. The price of the currency factors are affected by different factors, including fundamental events, market opinion, and perception, etc.
However, technical analysis only takes historical price patterns into consideration. If you are making trade decisions purely using technical analysis, then it may affect the entire trade result.
Need for confirmation
As discussed above, multiple indicators are there to conduct the technical analysis of the financial markets. However, solely relying on one indicator or using numerous indicators is not a good idea.
The indicator’s interpretation is based on what happened in the past, but there is no 100% guarantee that the same thing will happen again. So, one indicator may generate false signals.
That is why technical analysts used a combination of indicators to make trade decisions like Bollinger bands and RSI, Simple Moving averages and Stochastic oscillators, etc, for effective results. One can use two to three indicators for practical analysis.
Subjective
Technical analysis is subjective; the interpretation of different analysts may vary from each other.
Like two people looking at the chart in the same time frame, using the same indicators may generate opposite interpretations depending on how they see it.
Wrapping Up
We have covered each and every aspect of Technical analysis of the financial markets in this study. However, technical analysis can’t be summed up in a few words.
Also, proper knowledge is a must for using this analysis in trading. You can also refer to technical analysis forex books for a better understanding.
Before taking your journey ahead using this analysis, you should use technical analysis as a powerful weapon that you can use to win on the battlefield.
However, the results depend on how effectively you have used this powerful weapon. A trader should embrace technical and fundamental knowledge, proper planning, and strategic decision-making to use it effectively.
Get Complete Forex Trading Assistance