Fear and Greed Index: Guide for Tracking Market Mood Index
Learn what the Fear and Greed Index is, how it works, its benefits, risks, & historical examples. Keep a track of market sentiments and trade effectively.
Table of Contents
Do you track the Fear and Greed Index before making a buying or selling decision?
If not, you may be missing one of the most important parts of trading market emotion.
Markets do not move on logic alone. They move because people react to fear, confidence, panic, and greed. These emotions repeat in cycles and directly affect price trends, volatility, breakouts, crashes, and bubbles.
In this guide, you’ll learn what the Fear and Greed Index is, how it works, how traders interpret it, where to check it live, common mistakes, and how to use it correctly without emotional bias.
What Is the Fear and Greed Index?
The Fear and Greed Index is often referred to as the fear-greed index or greed-fear index. It is a market sentiment indicator developed by CNN Business to track the movement of the market.
The indicator is useful to measure how fearful or greedy investors are at any given moment. By tracking emotions and sentiment data from multiple markets, traders decide whether to enter or exit a trade or not.
The index works on a scale from 0 to 100:
0 = Extreme Fear
100 = Extreme Greed
Instead of predicting prices, the index explains why markets behave the way they do by tracking emotional pressure behind price movement.
The Fear and Greed Index chart helps traders understand whether market prices are being driven by exit panic, caution, confidence, neutral behaviour, or excessive optimism
Where to Check the Fear and Greed Index Live
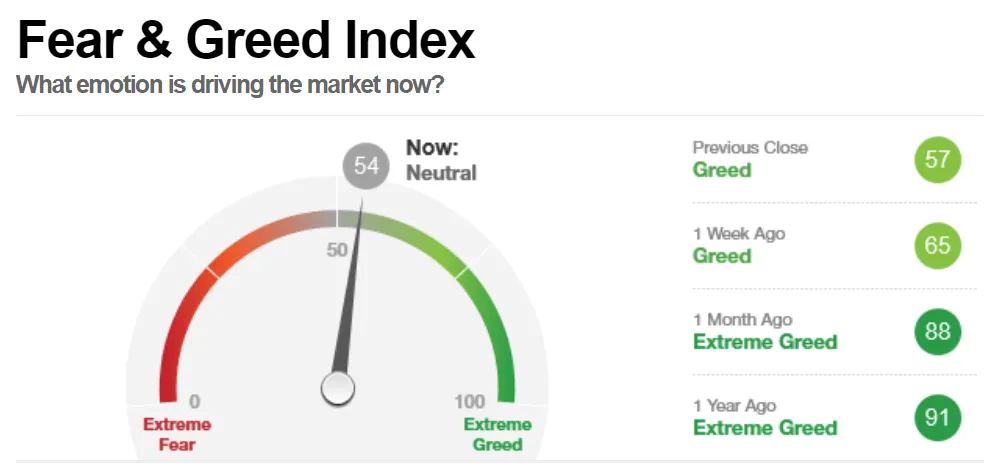
You can track the live Fear and Greed Index directly on CNN Business.
Key things traders should understand:
The index is updated daily
It shows current reading, previous reading, and historical trend
One single reading should never be used alone for trade entry
Professional traders focus on changes in sentiment, not just the number.
Examples of Fear and Greed Index Extremes
In history, many time fears and greed index dominated the trader’s psychology. Let’s see how:
2008 Global Financial Crisis
During the financial crisis, the index stayed in extreme fear for extended periods. The investor sentiments are dominated by systemic risk, bank failures, and liquidity concerns.
2020 COVID-19 Market Crash
As global lockdowns began, uncertainty surged. The index dropped sharply into extreme fear, reflecting widespread panic and risk aversion. The extreme fear leads to high volatility and strong directional moves.
Key Indicators That Build the Fear and Greed Index
The fear and greed index is made up of multiple indicators. From momentum, volatility, to safe-haven demand, it takes all the important trading elements into consideration. Let’s see the key indicators of the fear and greed index:
1. Price Momentum
This measures the S&P 500 relative to its 125-day moving average.
Strong upside momentum suggests optimism and greed, while weak momentum signals fear.
2. Price Strength
Price strength means how strong and stable the price movements are. It compares the number of stocks making 52-week highs to those making 52-week lows on the NYSE.
A higher number of new highs indicates confidence. Meanwhile, a lower number of lows indicates
3. Price Volume
The index analyzes the trading volume in advancing stocks versus declining stocks. A high volume reflects healthy sentiment, while narrow participation signals caution.
4. Market Volatility (VIX)
The CNN’s greed and fear index uses the CBOE Volatility Index based on a 50-day moving average. High volatility means uncertainty and fear. Low volatility means stability and confidence.
5. Safe Haven Demand
The index compares returns of stocks to safe-haven assets like bonds and precious metals. Higher demand for safe assets signals fear-driven behavior.
How to Interpret the Fear and Greed Index Levels
Extreme Fear:
When the Fear and Greed Index falls between 0 and 24, it signals extreme fear in the market. This phase is usually driven by panic selling, negative news flow, and strong bearish momentum.
Prices often move sharply lower, and volatility remains high as investors rush to protect capital. Traders avoid taking any position during such times.
Fear:
Readings between 25 and 44 indicate fear, but not full panic. Market participants are cautious, risk appetite is low, and traders prefer safer positions. Downtrends may continue, but price movements are often more controlled compared to extreme fear conditions.
Neutral:
A neutral reading shows balanced sentiment its generally when the index falls between the levels of 45-55. Neither fear nor greed dominates the market; this phase often provides clearer trading opportunities with reduced emotional interference.
Greed:
When the index moves into the 56–75 range, greed begins to dominate. Investors grow confident, risk-taking increases, and buying pressure strengthens. While trends may continue upward, the risk of overextended prices and sudden pullbacks also starts to rise.
Extreme Greed:
Extreme greed is when the index moves between 75 and 100. It reflects overconfidence and excessive risk-taking. Markets are often crowded with long positions, driven by FOMO and unrealistic expectations. Although prices may keep rising, the risk of sharp corrections or trend reversals increases significantly.
How Traders Use the Fear and Greed Index
Extreme Fear (0–24):
This is not an instant buy zone. Traders should focus on capital protection and wait for a clear reversal or support confirmation before buying, or trend traders may continue selling with strict risk control.
Neutral Market (45–55):
This is often the best phase for trading, as price action respects technical levels. Traders can make buy and sell decisions based purely on technical and fundamental setups.
Extreme Greed (76–100):
Fresh buying becomes risky. This phase is better for booking profits or reducing exposure, while short trades should only be taken with strong reversal confirmation.
Benefits of Using the Fear and Greed Index
Identifies Emotional Extremes:
The Fear and Greed Index helps traders recognize when markets are driven by panic or excessive optimism, highlighting emotional extremes that often lead to irrational decisions.
Supports Risk Management:
Extreme readings alert traders to heightened risk conditions, encouraging better position sizing, tighter stop-losses, and capital protection during volatile phases.
Promotes Psychological Balance:
By offering an objective view of market sentiment, the index helps traders maintain emotional control and avoid fear- or greed-driven behavior.
Applicable Across Markets:
The Fear and Greed Index can be applied across equities, forex, crypto, and broader risk-on/risk-off environments, making it a versatile sentiment tool.
Encourages Logical Trading:
The index explains the emotional backdrop behind price movements, helping traders understand why markets are behaving a certain way.
Rather than reacting impulsively, traders use sentiment data to align decisions with structured analysis and disciplined strategies.
How Traders Actually Use the Fear and Greed Index
Extreme Fear: Capital protection first. Wait for confirmation or trade with strict risk control
Neutral Zone: Best environment for technical and fundamental trading
Extreme Greed: Reduce exposure, book profits, avoid emotional buying
Smart traders treat the index as context, not a signal.
Fear and Greed Index vs Other Sentiment Indicators
| Indicator | What It Measures | Key Limitation |
|---|---|---|
| Fear & Greed Index | Overall market emotion | No timing signals |
| VIX | Volatility expectations | Spikes lag news |
| Put/Call Ratio | Options sentiment | Can stay extreme |
| Market Breadth | Participation strength | Market-specific |
Common Mistakes Traders Make Using the Fear and Greed Index
Buying blindly during extreme fear
Shorting blindly during extreme greed
Ignoring trend direction
Treating it as a trade trigger
Using sentiment without confirmation
The index explains emotion, not entries.
Limitations of the Fear and Greed Index
Does Not Give Exact Buy or Sell Signals:
The index does not tell traders precisely when to enter or exit a trade. It only highlights sentiment conditions that require confirmation.
Reflects Current Sentiment Only:
It captures present market emotions and does not predict future price movements or trend reversals.
Requires Broader Analysis:
The Fear and Greed Index must be combined with technical analysis, fundamental insights, and macroeconomic factors for effective decision-making.
Final Words
The Fear and Greed Index offers a powerful way to understand the emotional state of the market. While it cannot tell you exactly when to buy or sell, it helps you avoid emotional mistakes and trade with clarity.
Traders who master sentiment analysis gain an edge by responding to markets rationally instead of emotionally.
If you want to learn how to apply the Fear and Greed Index professionally. Open a demo account with Beirman Capital and start practicing sentiment-based trading.
FAQ
The Fear and Greed Index is a market sentiment indicator that measures investor emotions. So that traders can track the market mood and place trades accordingly.
Traders can watch the levels of the index to use the tool. The index moves on a scale from 0 to 100, where 0 represents extreme fear, and 100 represents extreme greed.
The Fear & Greed Index is calculated and updated daily, using real-time market data from multiple indicators such as market momentum, volatility, options activity, and safe-haven demand.
Readings below 25 indicate extreme fear, while readings above 75 indicate extreme greed. A reading of 45-55 is often considered the best phase to trade.
Get Complete Forex Trading Assistance