Confluence in Trading: Strategy, Examples & Checklist for High-Probability Trades
Trading confluence is the “secret sauce” of institutional profitability. It is the process of combining at least three independent signals such as a key psychological level, a price action trigger, and a technical indicator to validate a single trade entry. One signal is a guess; three signals are a strategy.
Table of Contents
The majority of novice traders use one indicator to determine the time to enter or leave a trade. Nevertheless, seasoned traders seldom use one indicator. They instead seek confluence in trading, whereby several factors converge to favour the same trade idea.
Confluence happens when multiple technical signals converge toward the same market movement, like support and resistance signals, indicators, price action and trend direction. This alignment assists traders to sieve weak setups and concentrating on high probability setups.
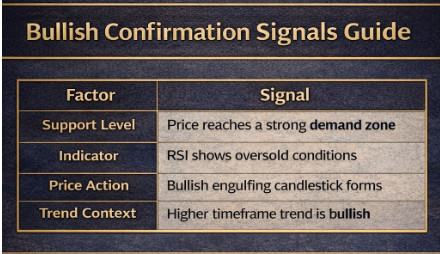
As an example, a trade is more powerful when the price is at a major support level, an indicator indicates oversold, and a bullish candlestick is present. In this guide, we shall define the meaning of confluence in trading, the different confluences that traders employ and how to make use of them.
What Is Confluence in Trading?
In modern financial markets, confluence is the convergence of multiple analytical layers at a single price point. While novice traders chase “holy grail” indicators, professionals look for the “stacking of odds.”
When an RSI oversold signal aligns with a historical support zone and a bullish pin bar, the probability of a successful reversal increases exponentially.
Confluence in trading refers to a number of independent signals being congruent in order to support the same trade idea. Traders do not use one indicator but rather a combination of various factors to enhance the chances of a successful trade.
Such indicators may be support and resistance levels, indicators, price action patterns or trend direction. When multiple of them are aimed at the same result, the arrangement is more robust and credible.
As an example, a possible buy trade can have multiple confirmations simultaneously:
Why Do Professional Traders Wait for Confluence?
Trades made by professional traders are seldom made based on one signal. Markets are dynamic, and individual indicators may tend to give false or misleading signals, particularly in volatile markets. The confluence wait assists traders in ensuring that there are various elements in the market that reinforce the same trade idea.
When a number of factors are in line, traders have better confidence in their setup and are able to handle risk better. Confluence also assists in minimising emotional decision-making since the trades are founded on unambiguous, rule-based confirmations as opposed to guesswork.
The main advantages of trading with Confluence are:
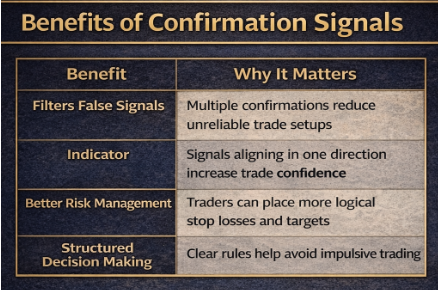
Benefit | Why It Matters |
Filters False Signals | Multiple confirmations reduce unreliable trade setups |
Higher Probability Trades | Signals aligning in one direction increase trade confidence |
Better Risk Management | Traders can place more logical stop losses and targets |
Structured Decision Making | Clear rules help avoid impulsive trading |
By waiting for two or three strong confirmations instead of reacting to every signal, traders can focus on quality setups rather than quantity of trades.
What Counts as Confluence in Trading?
Confluence in trading does not necessarily imply the combination of multiple indicators. Confluence can be formed by any independent factors that favour the same direction of the market. The point is that various types of analysis prove the same trade arrangement.
Traders tend to seek indicators provided by technical indicators, price action, important support or resistance levels, and the general direction of the trend. When all these factors come together, the arrangement becomes more stable since the market is demonstrating the confirmation of various points of view.
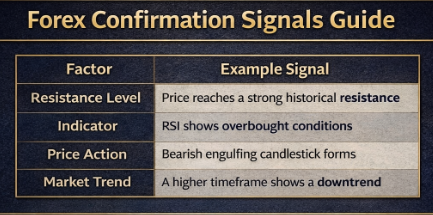
As an illustration, a possible sell trade is enhanced when multiple bearish indicators are observed simultaneously.
Types of Confluences in Trading
Confluence is possible in various ways for traders since markets offer various types of information, including price levels, indicators, and market structure. The convergence of signals of various kinds of analysis reinforces the entire trade arrangement.
The most typical forms of confluences that traders seek are listed below:
Technical Indicator Crossover
This happens when there are several indicators that point in the same direction.
As an illustration, a bullish formation can be observed when the RSI indicates oversold, the MACD indicates a bullish crossover, and the price action is above a moving average. These signals increase the likelihood of a possible upward movement when they agree.
Price Action Confluence
Price action confluency happens when the candlestick patterns appear on significant price levels, like support or resistance.
Example setups include:
- The formation of pin bar at the support.
- Strong absorbing candle on demand levels.
- Rejection borders on resistance.
These trends affirm that either buyers or sellers are responding to important levels.
Multi Timeframe Confluence
Most professional traders examine several periods before they get into a trade.
For example:
- The daily chart is on an uptrend.
- According to the 4-hour chart, there is a support pullback.
- The 1-hour chart is a bullish entry pattern.
The trade concept is more powerful when the periods coincide.
Liquidity Confluence and Market Structure
Market structure and liquidity zones are also analysed by advanced traders.
For example:
- Break of structure
- Retest of a key level
- Pre-reversal liquidity sweep.
These are usually indicators of where institutional traders can be operating.
How to Identify Confluence on a Chart
Identifying confluence on a chart is a structured process. Instead of randomly combining indicators, traders analyse the market step by step to see whether multiple signals support the same trade idea.
Step 1: Identify the Overall Trend
Begin by examining the longer period to know the direction of the market. Trading the trend usually enhances the chances of success.
Step 2: Mark Key Support and Resistance Levels
The second step is to determine key price levels that the market has responded to in the past. These are the areas that tend to intervene by buyers or sellers.
Step 3: Look for Indicator Confirmation
After a price hits a significant level, traders will look at indicators like RSI, MACD, or moving averages to determine whether they are in favour of the possible direction of the trade.
Step 4: Wait for Price Action Signals
Patterns of price action, such as engulfing candles, pin bars or rejection wicks, may also serve as further evidence that the market is responding to the level.
Step 5: Evaluate Risk and Reward
Traders will evaluate whether the arrangement is a good risk-to-reward ratio before they engage in a trade, and usually they seek a ratio of at least 1:2 or higher.
When a combination of some of these factors occurs together, they form a confluence of signals which provide the traders with more confidence to proceed to the market.
Confluence Trading Strategy
A confluence trading strategy involves trading only when there are several confirmations at a major price point. Traders do not respond to each movement of the market; they wait until they see setups that favour the same direction.
A classic confluence-based approach is based on this framework.
1. Start With Market Context
The greater market trend is analysed with a longer time frame, like the 4-hour or daily chart. Trading with the prevailing trend enhances the chances of success.
2. Identify a High Interest Price Zone
Mark price reaction areas, including support, resistance areas, supply zones, or demand zones. These places tend to have high buying or selling pressure.
3. Wait for Multiple Confirmations
Before entering a trade, traders look for additional signals such as:
- Indicator confirmation (RSI or MACD)
- Candlestick patterns
- Trendline reactions
- Volume spikes
When two or three signals appear together near the same level, the setup becomes significantly stronger.
4. Execute the Trade With Clear Risk Management
Risk is always defined by professional traders before taking a position. This involves putting a stop loss above the key level and a realistic profit target.
This disciplined method is stressed in many structured trading programs since waiting until there is confluence assists traders in making decisions free of emotion and concentrating on well-validated market structures, which is frequently emphasised in institutions and trading education courses such as Beirman Capital when teaching strategy development.
Confluence Trading Example
It is easier to understand confluence by examining a real trade situation. In the real markets, traders tend to wait until a number of signals are in line before they can take a position.
Take an example of a possible purchase order on EUR/USD. Price is approaching a good support level where the market has already turned back. Meanwhile, the RSI indicator indicates oversold situations, which indicate that the selling pressure can be decreasing.
Shortly after, a bullish engulfing candlestick is developed at the support zone, which means that buyers are entering the market.
Such a combination of signals forms a definite confluence.
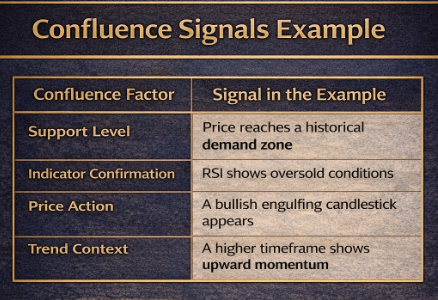
Because several independent signals support the same direction, the setup becomes stronger than relying on a single indicator. Traders often use these types of confluence-based setups to identify higher probability opportunities while maintaining disciplined risk management.
Confluences in Day Trading
Confluence is also critical in day trading, where the market trends are quicker, and traders have to make decisions within a shorter period. Since intraday markets can be very volatile, using one signal usually results in false entries.
Day traders normally integrate price levels, indicators and market timing factors to validate a trade set-up. When a number of signals coincide over a very short period, it enhances the trade confidence.
Factors of common confluence that are applied in day trading include:
Common confluence factors used in day trading include:
- VWAP (Volume Weighted Average Price) acts as dynamic support or resistance
- Opening range levels where the market establishes early direction
- Intraday support and resistance zones
- Volume spikes during breakouts
- Market session timing, such as the London or New York open
For example, if price breaks above the opening range while volume increases and VWAP supports the move, these signals together create a day trading confluence, suggesting stronger momentum in that direction.
Trading Confluence Checklist
Checklist Factor | What to Look For |
Market Trend | Is the trade aligned with the higher timeframe trend? |
Key Price Level | Is the price near a strong support or resistance zone? |
Indicator Confirmation | Do indicators such as RSI or MACD support the setup? |
Price Action Signal | Is there a clear candlestick pattern confirming the move? |
Risk to Reward | Does the trade offer at least a 1:2 risk-to-reward ratio? |
If several of these factors align, the trade setup becomes stronger because the market is providing confirmation from different perspectives.
Structured trading programs often encourage traders to use checklists like this to evaluate market conditions consistently. Educational environments such as Beirman Capital emphasise disciplined frameworks like confluence-based checklists to help traders develop more systematic decision-making in real market situations.
Common Mistakes Traders Make With Confluence
Although confluence may enhance trade arrangements, the concept is abused by many traders. It is not aimed at adding as many indicators as possible, but rather to integrate independent signals that verify the same direction of the market.
The first error is that it is easy to clutter charts with indicators, and this can confuse instead of bringing clarity. The other problem is the use of indicators that measure the same data, like combining several momentum indicators, which tend to give similar signals.
A common mistake is Redundant Confluence. If you use the RSI, Stochastic, and Williams %R, you aren’t getting three signals you are getting the same signal three times. These are all momentum oscillators.
The following are some of the common errors:
- Using too many indicators
- The combination of indicators that present similar information
- Disregarding the general market trend
- Trading against explicit confirmation
Successful confluence is quality-oriented and not quantity-oriented, and it assists traders in making more disciplined and clear decisions.
Is Confluence Trading Actually Profitable?
Confluence trading has the potential to enhance decision-making since it is based on a variety of confirmations and not just one. Traders can determine setups more likely when various variables come into play, like the price levels, price indicators and the market structure.
Nevertheless, confluence does not imply lucrative trades. Financial markets are volatile, and even well-established ones may collapse. Effective traders are able to merge confluency with risk management, discipline in their execution and size of their positions.
Practically, confluence is most effective when the traders consider it as probability based method, and every trade is analysed on the basis of structured rules rather than on the basis of emotional judgments. In the long run, this strategy assists traders in concentrating on high-quality and consistent setups, as opposed to low-confidence trades.
Conclusion
Confluence in trading is a strong idea that enables traders to make better decisions by using a combination of signals rather than using one indicator. When the support and resistance, technical indicators, price action, and market trend are in line, the likelihood of a successful trade setup is likely to increase.
Nevertheless, it should always be accompanied by appropriate risk management and strict trading regulations. The idea is not to identify ideal trades, but to concentrate on arrangements in which the market gives greater confirmation.
Learning to find and use Confluence, traders will be able to create a more systematic way of chart analysis and choose better opportunities. These probability-based frameworks are stressed in many professional trading settings, such as Beirman Capital, to assist traders in developing a consistent decision-making pattern in actual market circumstances.
FAQs
Confluence is significant as it validates a trade with several signals like indicators, price action, and support levels. When the factors are in line, the traders minimise the false signals and maximise the chances of successful trades.
Confluence is a trading method where traders will only place trades when various signals converge around the key levels. This assists in setting logical stop losses and targets, which enhance risk-to-reward ratios and minimise unwarranted trades.
The most effective confluence usually involves trend direction, support or resistance levels and confirmation of price action. Most traders also incorporate such indicators as RSI or moving averages to enhance trade arrangements.
RSI is employed as a confluence by validating other tools. As an illustration, when the price hits the support, and RSI displays oversold, it reinforces the possible bullish trade formation.
Before entering a trade, most traders seek two to three powerful confluences. Excessive indicators may be confusing, whereas a few confirmations are reliable and offer more effective setups.
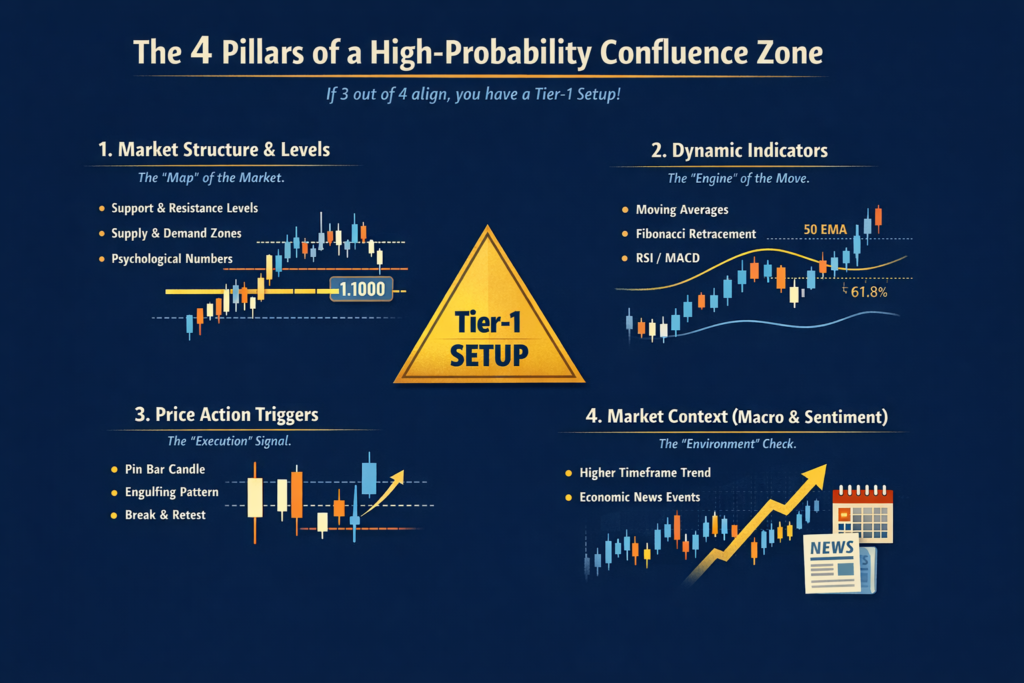
Ideally, three. Two signals provide a baseline, while three or more create a “High-Probability” zone. More than five can lead to “Analysis Paralysis,” where you never take a trade because you’re waiting for too many things to happen.
Get Complete Forex Trading Assistance