Bear-Bull Pennant Guide: How the Shape of a Pennant Signals Trades
Bear & Bull Pennant are the technical analysis tools that can suggest potential moves. Learn to identify, interpret, & trade them for profitable results.
Table of Contents
Are you a technical analysis trader who loves to trade different chart patterns and make money in the market? If yes, then this article is for you.
Here, we are going to discuss Bear and Bull Pennant, the most popular candlestick patterns, and how to trade them. In this pennant guide, we will cover the stock pennant formation, the shape of a pennant, and how pennants indicate potential breakouts.
We’ll also explore bull pennant volume, the bullish pennant pattern, and even how pennant banners relate to trading psychology. So let’s get started.
What is Pennant?
A pennant is a technical analysis chart pattern to identify buying and selling opportunities in the financial asset. It is a continuous chart pattern that is formed during a pause after a large or significant movement in the asset price.
After a strong uptrend or downtrend, when traders take a pause, the price again starts moving in the same direction. During such a scenario, a symmetrical triangle appears in a chart that is known as a pennant.

Key Components of Continuous Chart Pattern
Identifying pennant formation is quite easy when you know its components. Here is what you need to look at in a chart to determine pennant:
Flagpole:
A large and strong price movement in an asset price.
Price Consolidation:
A small pause after a strong trend. The pause occurs when the market participant takes a break or consolidates their position. It is the phase that indicates indecision in the market.
Price Breakouts:
A price breakout is when, after a period of consolidation, the price again moves in the previous direction.
Bull Pennant
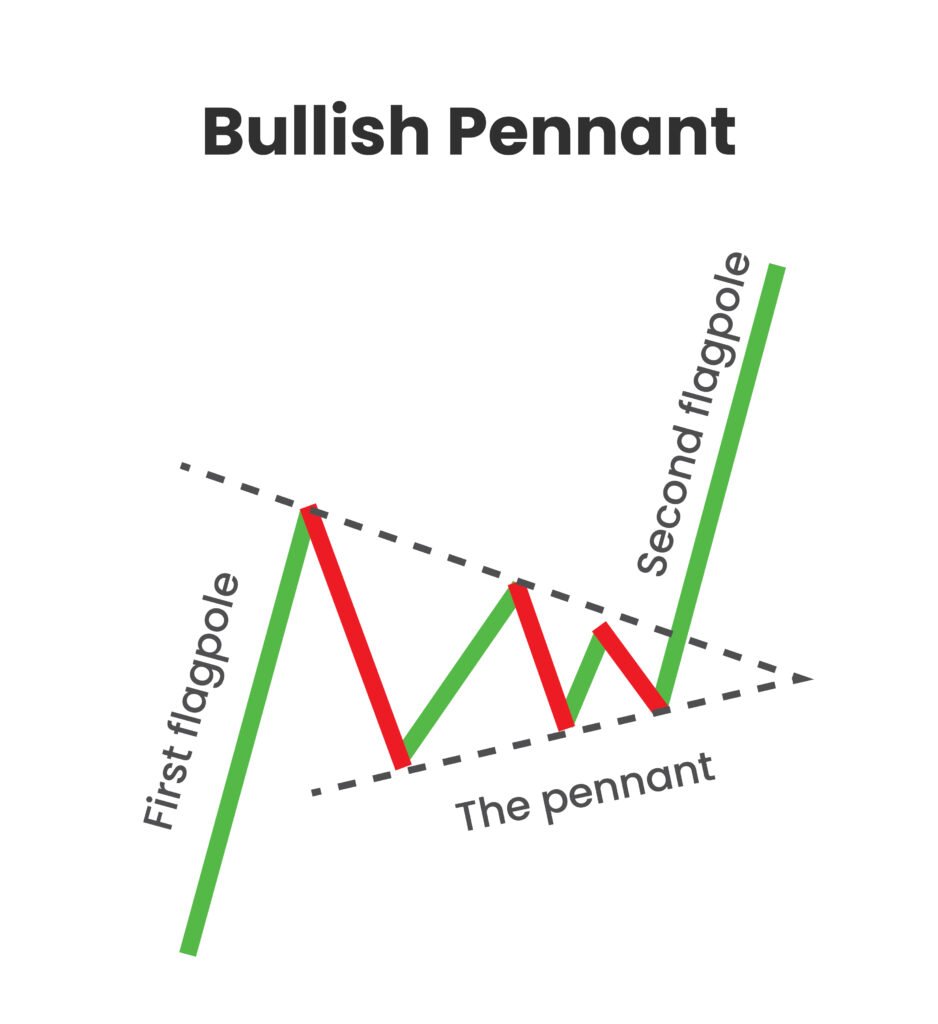
A Bullish pennant is a symmetrical triangle that forms after a strong upward movement in an asset price. The movement is followed by a small consolidation between the support and resistance and then the price again starts moving in the upward direction.
To identify a bull pennant shape in a chart, a trader needs to determine a flag or pole that shows a strong bullish trend and a symmetrical triangle that shows a price consolidation. Once you have spotted a similar pattern, you can predict the future price direction.
How to Interpret Bullish Pennant Pattern
Indecision:
When the price of an asset consolidates between support and resistance after an uptrend, it suggests indecisions in the market. In such cases, traders should not take any position and wait till it breaks or provide further price clarifications.
Bullish Opportunities:
A bullish pennant forms a symmetrical triangle on a chart. When the prices of an asset break the upper trendline of a triangle, it suggests that the trend will continue, and the prices are expected to rise further. In such cases, traders can open a buy position in an asset.
Bull Pennant Volume Analysis:
Bull Pennant’s interpretation is simple. Buy when the price breaks the upper trend lines and wait until the price consolidates.
Well, if you think in a similar way, then it’s not like that. Like any other technical analysis tool, bullish pennants can also generate false signals. However, you can identify the strength of patterns by volume analysis.
The low trading volume during the start of the pattern and the high trading volume during the breakout work as confirmation for the pattern.
Bearish Pennant:
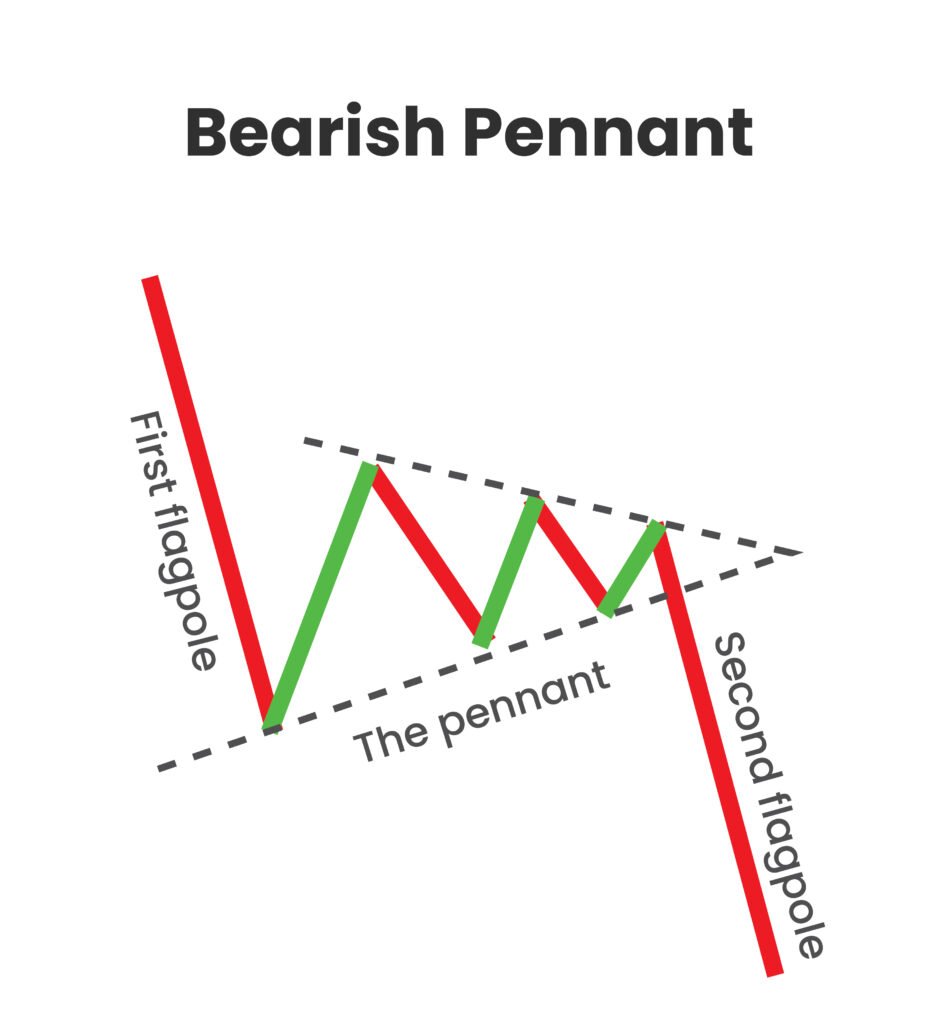
A Bearish pennant is just the opposite of a bullish pennant. It is a symmetrical triangle that forms after a strong bearish movement. The movement is followed by a small consolidation between the support and resistance, and the price again starts moving downward.
To identify a bearish pattern in a chart, a trader needs to determine a flag or pole that shows a strong bearish trend and a symmetrical triangle that shows a price consolidation.
How to Interpret Bearish Pennant Pattern
Indecision:
When during a strong downward trend, sellers take a break, buyers enter the market, and both parties push the price, consolidation occurs. It leads to the formation of the symmetrical triangle. During this period, traders should avoid taking any position and wait for potential breakouts.

Bearish Opportunities:
After the price consolidation, the price of the asset again starts moving in a downward direction and breaks the lower trendlines, suggesting that the price falls further. Traders can consider opening a short position during such scenarios.
Bearish Pennant Volume Analysis:
The trading volume is the same irrespective of the bullish or bearish pennant. Low trading volume during consolidation and high trading volume during breakout work as confirmation of the pattern.
Limitations of Bullish and Bearish Pennants
Complex:
First, pennant is not enough; a trader needs to have knowledge of other patterns and indicators. Secondly, identifying and interpreting pennants requires an in-depth understanding of technical analysis. So, it can be complex for beginners or novice traders.
Ignore Broader Market Aspects:
The price of forex, crypto, stock or any other financial product is affected by macroeconomics and geopolitical factors. However, patterns such as bull or bear pennants only focus on the technical aspects. So, they are not that effective during such market scenarios.
Subjective:
Interpreting bear or bull pennant is subjective. Two traders watching the same pennant may come with different interpretations. Also, delays or early entry and exit can affect the overall results.
False Signals:
When using pennant or similar candlesticks, a trader should understand that you need not enter a trade at every breakout. Sometimes, the technical analysis indicators may generate false signals, and following them results in significant losses.
Confirmation Required:
Traders cannot make trade decisions solely based on bullish or bearish pennants. They need to confirm the interpretations with other technical analysis indicators such as Bollinger bands, moving averages, and oscillators.
Bottom Line
Bear and Bull pennants can serve as a valuable guide for traders in identifying potential opportunities. Traders can even get insights for placing trade entry, exit, and stop-loss points with these technical analysis tools.
However, as we have studied above, the tools have some limitations. Knowledge and practice are the two elements that help you in dealing with limitations and using pennants effectively.
At Beirman Capital, we offer our clients with demo account facility so that our clients can practice different tools, indicators, and patterns in live market conditions. Open a demo account with us and master technical analysis.
FAQs
- How accurate is a bullish pennant?
The bullish pennant pattern success rate lies somewhere between 50 to 60%.
2.What happens after a bull pennant?
When a bull pennant occurs, and the price breaks the upper trendline of a symmetrical triangle, it suggests that the bullish trend will continue,
3.Is a pennant bullish or bearish?
A pennant can be bullish or bearish, depending on the trend. With an upward trend, the pennant formation is bullish, and with a downward trend, the pennant formation is bearish.
4.What is the flag and pennant pattern?
A flag is a pole that reflects strong price movement in an asset. Meanwhile, a pennant is a symmetrical triangle formed after a consolidation within a strong trend.
5.What are the rules for a bullish pennant?
When the price breaks the upper trendlines of a bullish pennant, it is expected to rise further and suggest traders take a buy position.
Get Complete Forex Trading Assistance