Bull Flag: Mastering the Bullish Flag Pattern
A Bull flag is a technical analysis pattern that suggests a potential for buying moves. Discover how to spot, interpret, and trade the bullish flag pattern.
Table of Contents
Candlesticks form different patterns on the chart. A flag is one such useful and valuable pattern. It can be either bullish or bearish. The formation helps traders in identifying buying and selling opportunities.
In Beirman Capital’s indicator interpretation series today, we will discuss the Bull flag, how it looks, and the process to trade it. So let’s get started with the meaning.
What is a Bull Flag?
A bull flag is a technical analysis pattern that suggests a potential for buying moves. It forms during a strong bullish trend, followed by a period of consolidation.
The pattern completes with a resistance breakout that indicates to traders the possibility of a price rise. Traders can consider opening a buy position by interpreting it.
Key Components of Bull Flag Pattern
For identifying the bull flag pattern on a chart, you need to check the following components:
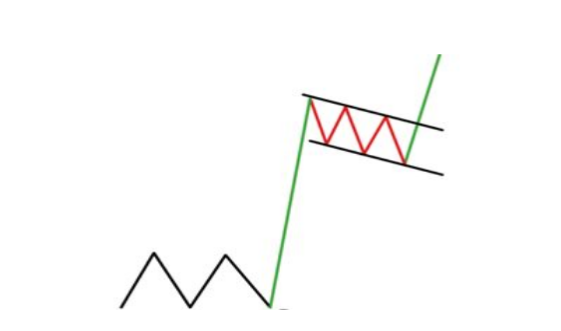
Trend: Look for a strong bullish trend. A bullish flag pattern appears when the price continuously rises. The strong bullish trend will act like a flag pole in the pattern.
Consolidation: An uptrend will be followed by a consolidation phase. It results in a temporary pause before trend continuation. A rectangular structure forms during consolidation, which acts as flag main portion.
Breakout: A bull flag breakout occurs when the price breaks the range and crosses above the resistance. A resistance breakout will suggest a potential for a bullish trend.
Volume: There is a significant volume at the initial stage. It declines during the consolidated phase and spikes again during the breakout.

How to Trade Bull Flag Pattern
Select the Asset: A bullish flag pattern can appear on any asset chart. So, identify the trading instrument that you want to trade. You can choose from forex, crypto, stock, or indices products.
Choose the time frame: A bullish flag pattern can appear in any time frame. Select the charting time frame. It can be of 5 or 15 minutes, 1 hour or 4 hours, daily, weekly, or monthly.
Watch the Trend: Bull flags form during a strong trend. So watch for green rising candles to determine the trend.
Wait for price consolidation: A bullish trend should be interpreted by a range-bound or sideways movement. The consolidation phase should be small.
Monitor Price Breakout: Wait till the price breaks the upper trend line of the bullish flag pattern. A resistance breakout completes the bull flag pattern.
Seek Confirmation: Traders enter a position as soon as a breakout occurs. But no, confirmation is a must. Use technical analysis indicators and analyze the volume to confirm its interpretation.
Enter a Buy Position: Once the breakout is confirmed, open a buy position. Set the take profit and stop loss according to your risk-to-reward ratio.
Pros of the Bull Flag Pattern
Diversification: Traders can use the bull flag trading strategy for trading diverse assets. It includes currency pairs, stocks, indices, cryptocurrencies, etc.
Clear Trade Entry and Exit Points: Traders can determine the exact stop loss and take profit point using this strategy. For that purpose, check the distance between the flagpole and the breakout.
Compatibility: The bull flag pattern is compatible with a range of indicators. Traders can use it with multiple indicators such as Bollinger Bands, moving averages or Fibonacci.
Cons of the Bull Flag Pattern
Confusing: Bullish flag pattern forms a similar structure to a wedge or pennant. Traders can confuse these patterns, which can lead to misleading interpretations.
False Breakout: Trading early at a bull flag breakout may result in losses. As in the case of false breakouts, traders end up interpreting the pattern incorrectly.
No Guarantee of Price Movement: Even after the proper formation of the bull flag and confirmation, there is no guarantee of bullish trend continuation. The pattern can generate false signals in a choppy and highly volatile market.
Tips for Trading Bull Flag Pattern
- Always use the bullish flag by integrating it into technical analysis or volume indicators.
- Watch multiple time frames to have a broader overview of the market.
- The flag formation should not retrace more than 50% flag pole. Otherwise, the pattern will lose its reliability.
- Avoid trading the pattern during unstable market conditions such as high volatility or a choppy period.
- Watch market volatility throughout the pattern formation to check its effectiveness.
Bull flag vs Bear flag: Comparison Chart
The bull flag vs bear flag can be confusing for you. Here is a comparison chart for clarity:
Basis of Difference | Bull Flag Pattern | Bear Flag Pattern |
Trend | Appears during a strong bullish trend. | Appears during a strong bearish trend. |
Consolidation Phase | Generally, the flag form is slightly downward. | Generally, the flag form is slightly upward. |
Breakout | A Breakout of resistance or the upper trendline occurs. | A Breakout of support or lower trendline occurs. |
Indication | It suggests a bullish trend continuation. | It suggests a bearish trend continuation. |
Trade Decisions | Traders tend to open a buy position. | Traders tend to open a sell position. |
Wrapping Up
Bull Flag is an ideal trading chart pattern to trade diverse assets with a variety of strategies. It is easy to interpret, and trade with multiple ways for confirmation.
It does have some limitations, such as misinterpretations or false signals. However, proper practice can help you in dealing with these drawbacks.
Want to learn bull flag trading? Open a demo account with us and master chart pattern trading.
FAQ
What does a bull flag pattern mean?
A bull flag is a technical analysis pattern that suggests a potential for buying moves. It forms during a strong bullish trend, followed by a period of consolidation, and a breakout.
How reliable is a bull flag pattern?
A bull flag is a reliable pattern if used with proper confirmation.
What is the success rate of the bull flag pattern?
The success rate of the bull flag pattern is around 50 to 60%.
What invalidates a bull flag?
When the flag retraces more than 50% flag pole, the pattern loses its validity.
Can a bull flag fail?
Yes, a bull flag can fail especially in choppy and highly volatile market.
How do you confirm a bullish flag?
Check the volume and use technical analysis indicators for bullish flag confirmation.
Get Complete Forex Trading Assistance